| You are working building a hydro power dam in Mongolia. The bricks are to be imported from Bangkok, steel from London, cement from Ukraine, workforce is local, architect from Spain. All the labours had reached the site to start the work but the raw material is not there. Once steel comes in, the labourers are sitting idle as they cannot proceed unless the cement comes in as the structure cannot be started. |
Project Schedule: The art & science of scheduling the work such that the project is completed on time. And all the tasks are aligned with the planned timelines throughout.
Here is a snippet of various processes that are distributed across multiple phases of a project:
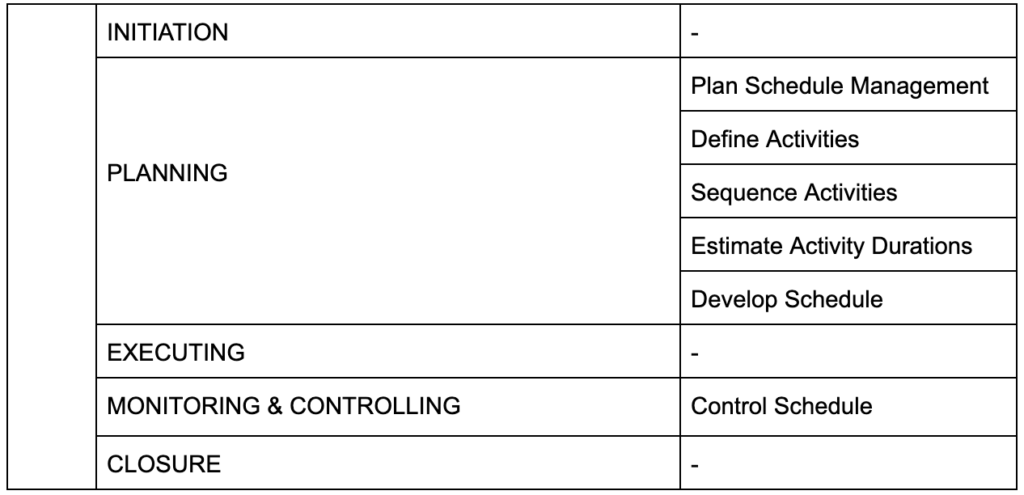
Phase: PLANNING Knowledge Area: SCHEDULE MANAGEMENT
The process of strategising and documenting on how to plan, manage and control the schedule of a project. This also requires the manager sequence the activities and measure their progress vs time throughout the project.
Schedule Management Plan: The output of this process is the Schedule Management Plan, which is a document that helps to estimating and scheduling faster. This helps to determine:
For your reference here is the template for Schedule Management Plan
Phase: PLANNING Knowledge Area: SCHEDULE MANAGEMENT
The Define Activities process takes the work packages that we created in the Create WBS process (scope management) and decompose them into activities that is required to achieve the deliverable.
IMPORTANT: Decomposition of work into smaller work packages is part of Scope Management, however decomposing them further to identify the activities to be done is part of Schedule. Hence, it is important to understand in exam what context is the question referring to.
Milestones: The Milestone are events in the define scope. They are no activities, not events and they DO NOT have any time durations. These are mere check points in the schedule.
At times, as the project progresses, there are multiple requirements that come up. Or at times initially the requirements are not clear and when the project proceeds; the requirements gets clearer.
Phase: PLANNING Knowledge Area: SCHEDULE MANAGEMENT
The activities that we defined in the last process are required to be sequenced in order which they will be performed; so that we can determine the schedule well.
For this, we need to create a network diagram that graphically shows the activities that are to be done in parallel or sequential manner.
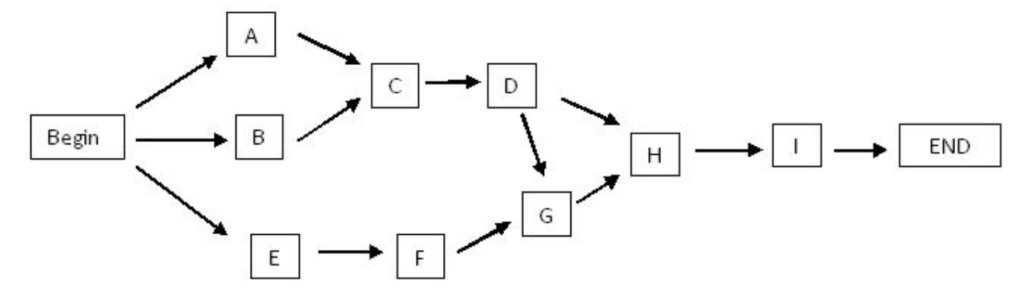
There are multiple ways to make a network diagram, earlier was
For now, most of the projects use PDM; which looks like this:
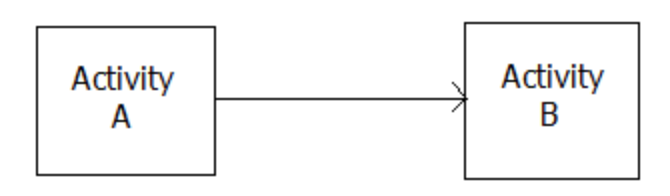
Nodes/boxes represent the activities. Arrows represent the dependence of activity.
There are 4 types of logical relationship between the Activities:
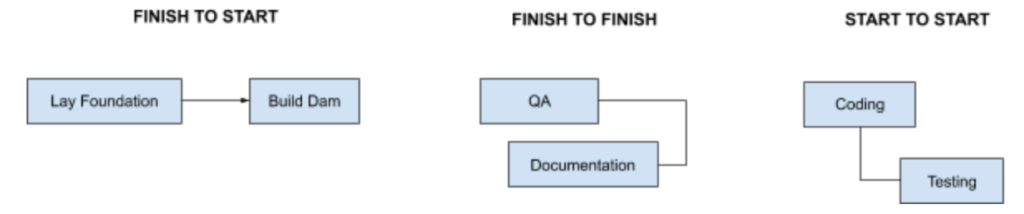
There are multiple types of dependencies:
LEADS: When Activity-B can be started in parallel with Activity-A rather than waiting for Activity-A to complete. This will save time.
LAGS: There is some gap time added between 2 activities for some mandatory reason. Like some days needed after activity-A is completed so that we can start activity-B. For example, the concrete is poured but we need to wait for it to dry so that we can paint.
Phase: PLANNING Knowledge Area: SCHEDULE MANAGEMENT
Since the past processes had defined the activities and sequenced them, now we need to estimate each of these activities so as to get an estimate for the project.
There are multiple methods of estimating the duration of the activity:
One Point Estimation: In this, the estimator gives one single estimated time to each activity. For example: The coding for payment integration in website will take 2 weeks.
As you may notice; the above estimation is based on historical data or expert judgement.
However, there are few things that are few other points to be noted:
Since there is just one estimation, hence the estimator may include some additional buffer just in case – it is called PADDING. The project manager should avoid that.
This also does not provide important info on risks, assumptions etc
Analogous Approach (Top Down): Based on the historical data, the timelines are provided, such that the home page design took 2 days to create in past 5 similar projects, hence it will take the same.
Parametric Approach: The process uses a mathematical equation based on the previous historical data:
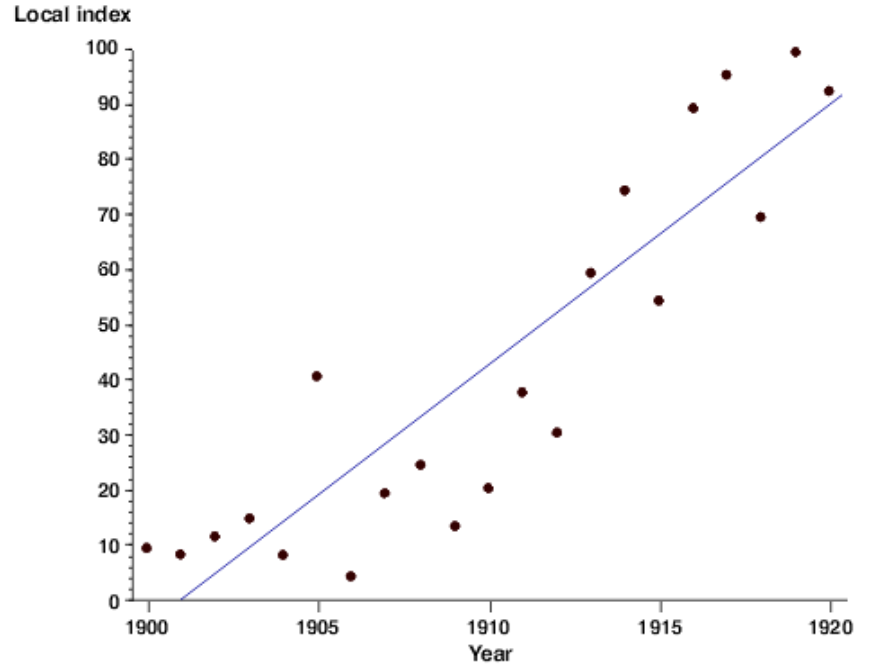
Regression Analysis (Scatter Diagram): This checks various data sets and plot them on the graph to see for similarity between 2 variables.
Learning Curve: This approach says that the time needed for an activity reduces if done again and again. Such that time needed to build the first wall would be 3 days, but it will take 1.5 days to build the 100th wall as the learning and skills are enhanced.
Bottoms Up Estimation: This estimation requires estimating each small activity individually. You need WBS for this, then estimate all activity/work package from it.
Heustiristics: This basically means using the best practice. There is no thumb-rule to use that practice however in general if something is widely accepted so it becomes a standard. For example; if there are 3 programmers in a team, there should be at least 1 QA.
Three Point Estimation: The triangular distribution actually requires 3 sets of estimation for the same activity.
TRIANGULAR ESTIMATION
First we pick an activity and estimate the time it will take to work on that if things go right (T-optimist), then estimating same activity considering what can go wrong (T-Pessimist) and then under generic conditions as most probable time (T-likely).
All these values are then taken average using the formula below:
| Tmostlikely= T optimist+T likely+T pessimist / 3 |
PERT/BETA DISTRIBUTION
The 3 estimates that we considered in above example can be used with a more precise formula considering their probability of occurrence.
| Tmostlikely= T optimist+T likely+T pessimist / 3 |
Standard Deviation refers to the bracket of deviation from the most likely estimate. For example a project is estimated to be finished in 100 Hours, it may take 8 Hours which means the project will be completed in 92 to 108 Hours. The formula for Standard Deviation is:
| S.D= T pessimist – T optimist / 6 |
DATA ANALYSIS
Alternative Analysis: In order to meet the projected schedule, at times the PM and team can look for options that can help to achieve the timeline. For example: instead of building QR scanner, PM can purchase an existing QR feature library which can save 5 days worth of time.
[IMP] Reserve Analysis: Every project has additional reserves in order to accommodate the risks. This is the responsibility of the PM to maintain a reserve. The types of reserves are:
Management Reserves: This is the reserve that is with Management and these are ONLY for any unknown risks. If a project is casually delayed without any unknown risk then the PM cannot ask the management for this reserve, it is ONLY for unknown risks.
Phase: PLANNING Knowledge Area: SCHEDULE MANAGEMENT
Phase: M&C Knowledge Area: SCHEDULE MANAGEMENT