| You are a Project Manager for creating manufacturing plant of Yamaha automobiles in Tel Aviv in Israel. The Yamaha plans to have this manufacturing unit produce 20,000 motorbikes per year. However, there was one small issue encountered during the work: the fuel transact pipe was next to combustion engine and was made of soft rubber. When checked the automobile worked fine. But, it was not tested well for the real-life scenarios and the company still goes ahead and launches. After few days, they are flooded with complaints as engine gets much more heated, it burns up the fuel pipe causing bike not to work or in some cases; severe accidents. |
Manage Quality: The process to ensure that the work is done while matching all the aspects of the quality as agreed on in the project requirements.
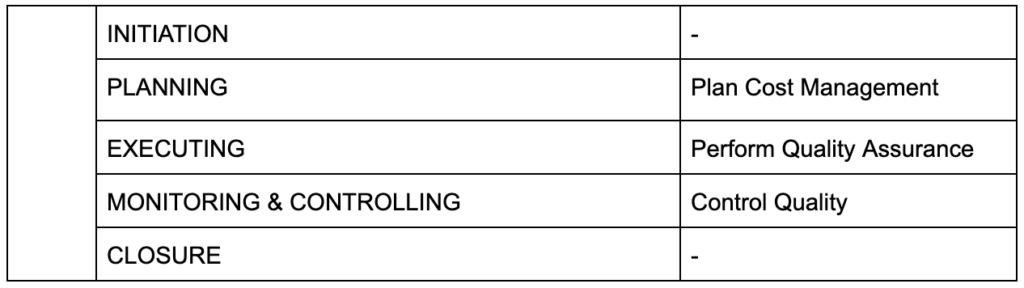
Phase: PLANNING Knowledge Area: QUALITY MANAGEMENT
Before we talk about anything; the first common misconception that people have in mind is about the term quality. So let us simplify what quality means in Project Management:
| Quality is the degree to which the project fulfils the requirements |
Quality means to meet the requirements and NOT adding extra. All the parameters for the quality are required to be agreed upon before the project execution starts.
The quality is NOT the ‘standards’ that is used in the market but instead it is mentioned in the plan for the project specifically.
For Example: You are working as the PM building a lead generation form. On the register page there are fields: Name, Phone Number and email. Usual practices in software developments states that ‘name’ should not allow special characters. Hence, you assume that to be the applicable and delivers the work. The client complaints that one of the users name Brian O’Leary is not able to register himself as the system throws an error.
There are multiple standards for quality as recognized internationally:
There are some tools and techniques to manage quality, the same are mentioned below:
Phase: EXECUTION Knowledge Area: QUALITY MANAGEMENT
During the project is being executed, the manage quality process is roped in; which is usually taken care by the testing group OUTSIDE of the project team.
This process refers the quality management plan to verify:
There are certain Tools and Techniques that are needed for managing the Quality, namely:
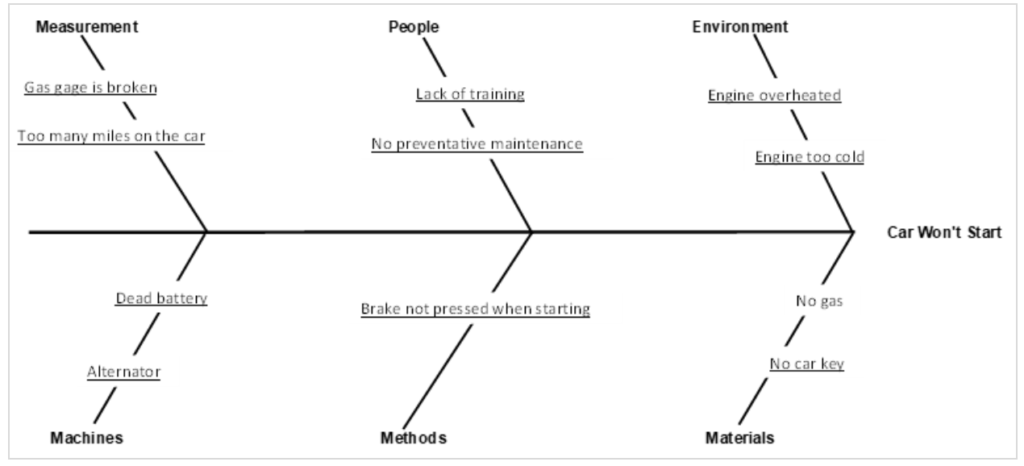
Checklist: The list of items to confirm the steps of the process. This helps to analyse defects discovered in quality process.Cause & Effect Diagram (Ishikawa or Fishbone or Why Why): A fishbone diagram is a visual way to look at cause and effect. It is a more structured approach than some other tools available for brainstorming causes of a problem (e.g., the Five Whys tool). The problem or effect is displayed at the head or mouth of the fish. Possible contributing causes are listed on the smaller “bones” under various cause categories. A fishbone diagram can be helpful in identifying possible causes for a problem that might not otherwise be considered by directing the team to look at the categories and think of alternative causes.
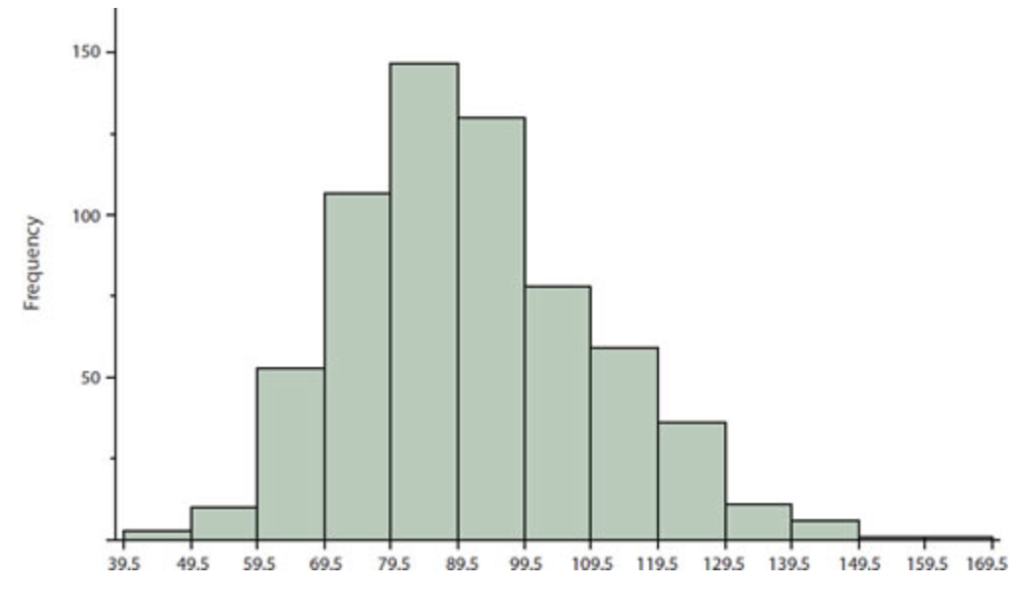
Histograms: The histogram is graphical bar chart of the type and frequency of defects in the system that helps to analyse the quality.
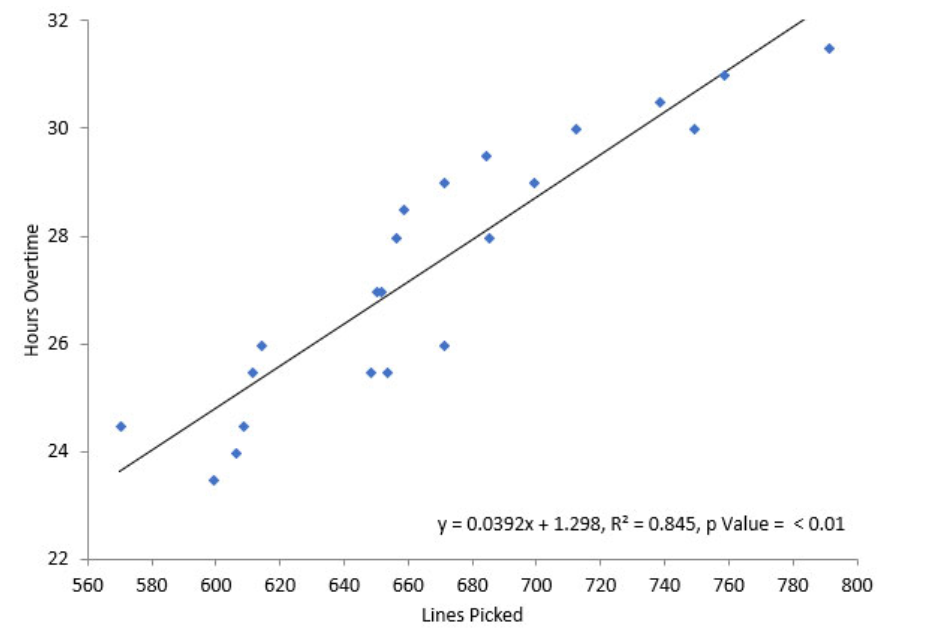
Scatter Diagram: This is a diagram that is used to map multiple data points and develop the relation between the same to understand the quality level.
Document Analysis: The review of the QA test reports to ensure quality is maintained as planned.
Alternative Analysis: To evaluate and check for all possible alternatives available. The DOE (Design of Experiments) is a technique used to analyse experiments, in which the experiments are performed to see the parameters that will enhance the quality. This helps to deliver the same level of quality for lesser costs.
Process Analysis: The continuous improvement of the process is also a major part of quality management. If one needs to paint 100 walls, then painting of 98th wall shall be easier than the first wall painted.
Root Cause Analysis: An approach to identify the process, procedure and policies that may not be working for the project or needs adjustment.
Multi Criteria Analysis: Using decision making techniques based on certain criterion for the improvisation of the quality is an important and continuous process. One of the factors is ‘prioritisation matrix’.
Flowchart: As mentioned earlier, the flow chart is used to show the process flow journey from beginning to end
Affinity Diagram: This technique is explained earlier in the Collect Requirements process in the Scope Management. Here the Affinity Diagram is used to organize and group the results of the root cause analysis.
Audits: The sudden audit of the work to check for the random elements to check for the quality of the work is known as audits.
Design of X: This is a method of analysing variables to evaluate the effectiveness of quality management plan and team’s ability to meet the quality objectives.
Problem Solving: This is the process of first; understanding of the problem, identify the solution and implement the best solution with a follow up review to ensure the solution had resolved the problem.
Phase: M&C Knowledge Area: QUALITY MANAGEMENT
The control quality is to perform quality audit and check if the product/service delivered meets the quality standards. This helps to gain customer acceptance.
At times, there is much confusion between Control Quality and Manage Quality; please note that Control Quality is used to address the defects and correct it. Manage Quality is to ensure that the plan is implemented well.
There are a few terms that will help to understand this process further:
Mutual Exclusivity: When two or more events cannot occur at the same time, they are called mutually exclusive. Example: You cannot place the furniture and paint the house walls at same time.
Probability: The likelihood of occurrence of an event.
Normal Distribution: This is the probability density distribution chart that is created, usually it is a bell shaped curve and is used to measure the deviations.
Statistical Independence: The probability of one event should not affect the probability of another event.
Standard Deviation (Sigma): The deviation from the median is called Standard Deviation. This helps to denote how far is the output away from desired results. As per PERT, the formula for Standard Deviation is:
| S.D= T pessimist – T optimist / 6 |
There are many Tools and Techniques for quality control that are important to understand:
Checklists: A list of items to inspect , steps to be performed, picture of items to be inspected.
Checksheets: This is the checklist with visual track of data to determine the problem found during inspection.
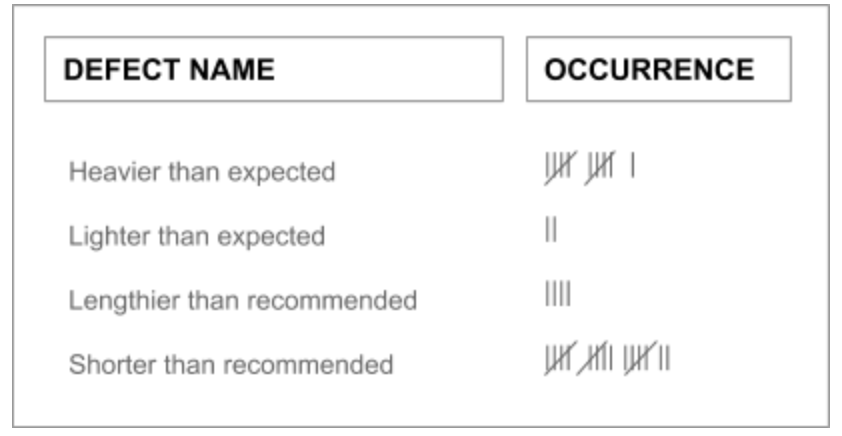
Statistical Sampling: The process of monitoring some random samples from the produced products in order to ensure the quality standards are met or else falls within allowable range is called statistical sampling. For example: There is manufacturing plan of pens; the pen is produced at rate of 1000 pens per minute, there are random pens tested out of the lot. The idle weight is 10gms with allowable variation of 2gms. There are 6 samples taken and the result shows those pens are of 9gm, 10gm, 10gm, 8gm, 11gm, 10gm, 11gm respectively. This is statistical sampling.
Questionnaire & Surveys: In order to fetch more data and insights on the defects, the quality team of PM may use surveys and questionnaire.
Performance Reviews: The periodic surveys done by the PM or the quality department to audit the quality of the work
Root Cause Analysis: To analyse the cause of the quality problems and defects, the Root Cause analysis is done.
Inspections: In order to verify the deliverables meet the requirements, the inspection is performed usually by the quality team.
[IMP] Control Charts: During the execution the output is plotted on a chart based on the samples collected. These points are analysed and hence the quality is measured.
For example, Suzuki had established a plant in Cairo, Egypt and started manufacturing of the Petrol tanks for its bikes. As the manufacturing was to be tested, the QA team collected some samples and measure the length of the tank, following are the outcomes:
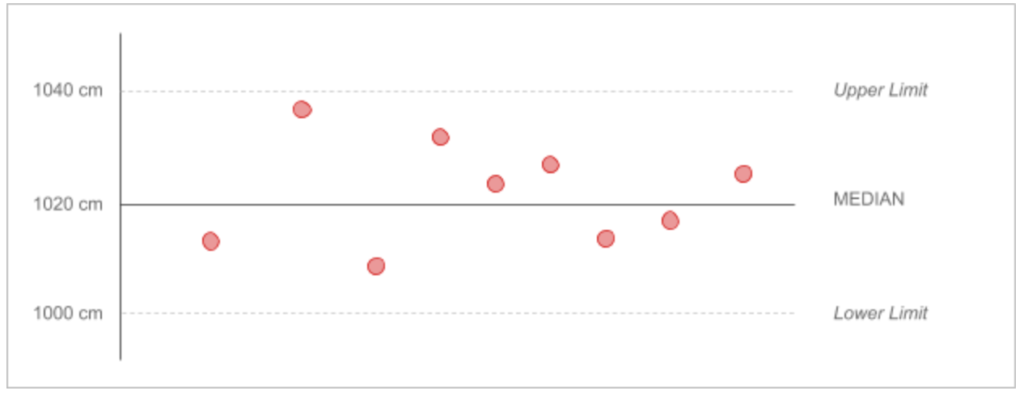
Upper and Lower Control Limit: The allowable range of the product is highlighted on top and bottom with dashed-lines. The highest acceptable range is the upper limit while the lowest range value is the Lower Limit.
Mean: The mean is the line at the centre that denotes the middle of the range.
Rule of Seven: The rule of seven (heuristic/general rule) states that if any random series of data points falls on one side of the median; even though they are still in control limits, then also process is out of control.
Out of Control: The process is considered as the Out of Control if any of the sample goes beyond the control limit OR even when they are in control limits but do not abide rule of seven
Special Cause Variation/Assignable Cause: This signifies that the process is out of control since some data point is beyond the control limits and requires the investigation.